Eco-Flow/excon
Have you ever wondered whether gene families are growing or shrinking across species? excon automates the full journey using the popular tool CAFE— from raw genome assemblies to publication-ready figures showing which gene families have expanded or contracted, and what biological processes they’re involved in.
Feed it a handful of species (anywhere from 3 to ~100), point it at genome and annotation files (or just give it NCBI RefSeq IDs and let it fetch everything itself), and excon handles the rest.
What does excon do?
excon is a Nextflow pipeline built to nf-core standards. Given a set of species with genome assemblies and gene annotations, it:
- Auto-Downloads - Genome (fasta) and Annotation (gff3) files.
- Formats your genomes — Uses AGAT/gffread to make sure they are compatible.
- Finds orthologous genes across all species using OrthoFinder.
- Detects gene family expansion and contraction using CAFE5, modelling copy-number changes along a phylogeny. Including all the error and k prediction steps.
- Annotates expanded/contracted families with GO terms — so you can go beyond which families changed to understand what they do.
All steps run in containers (Docker, Singularity, or Apptainer), making results fully reproducible across HPC clusters, cloud, and local machines. It alos has a host of other features to explore, so check out the repo for more.
Input
All you need is a simple CSV — either with NCBI RefSeq accession IDs (excon downloads everything for you) or paths to your own genome and annotation files. Or a mix of the two.:
# Option 1: let excon fetch from NCBI
Apis_mellifera,GCF_003254395.2
Bombus_terrestris,GCF_000214255.1
Polistes_canadensis,GCF_001313835.1

# Option 2: bring your own files
Apis_mellifera,/data/apis/genome.fna.gz,/data/apis/annotation.gff.gz
Output
These are the output files you should expect:
results/
├── cafe/
│   ├── base/                        # Base single-λ CAFE model outputs
│   │   ├── Out_cafe/                # CAFE5 output files (trees, counts, probabilities)
│   │   ├── hog_gene_counts.tsv      # Filtered gene count input to CAFE
│   │   └── hog_filtering_report.tsv # Filtering report (only present if retry triggered)
│   ├── gamma/                       # Gamma k=3 model outputs
│   │   └── Out_gamma/               # CAFE5 output files
│   ├── gamma_per_family/            # Gamma per-family rate model outputs
│   │   └── Out_gamma_per_family/    # CAFE5 output files
│   └── model_comparison/
│       ├── cafe_model_comparison.tsv # AIC, delta-AIC, AIC weights, LRT results
│       ├── best_model.txt            # Name of the winning model
│       └── Significant_trees.tre    # Nexus trees with significant branches (from best model)
├── cafe_plot/
│   └── cafe_plotter/                # Expansion/contraction plots for best model
├── cafe_go/                         # GO enrichment (one job per species/node x direction)
│   ├── CAFE_summary.txt             # Summary of expansions/contractions per branch
│   ├── *_TopGo_results_ALL.tab      # TopGO results per target
│   ├── TopGO_Pval_barplot_*.pdf     # Barplots per target
│   ├── Go_summary_pos.pdf           # Summary plot across all expansions
│   ├── Go_summary_neg.pdf           # Summary plot across all contractions
│   ├── Go_summary_pos_noNode.pdf    # As above, terminal branches only
│   └── Go_summary_neg_noNode.pdf
├── chromo_go/                       # [optional] GO enrichment by chromosome
│   ├── *.pdf                        # Per-chromosome GO plots
│   └── summary/                     # Summarized results across chromosomes
├── eggnogmapper/
│   └── go_files/                    # Per-species GO annotation files
├── gffread/
│   └── *.fasta                      # Protein sequences per species
├── ncbigenomedownload/
│   ├── *.fna.gz                     # Downloaded genome assemblies
│   └── *.gff.gz                     # Downloaded annotations
├── orthofinder_cafe/
│   └── ortho_cafe/                  # OrthoFinder results including species tree
├── busco/                           # [optional, --stats] BUSCO completeness results
├── agat/                            # [optional, --stats] AGAT annotation statistics
├── quast/                           # [optional, --stats] Assembly contiguity statistics
└── pipeline_info/
    ├── execution_report_*.html      # Nextflow execution report
    ├── execution_timeline_*.html    # Per-process timeline
    ├── execution_trace_*.txt        # Per-task resource usage
    ├── pipeline_dag_*.html          # Pipeline DAG diagram
    └── software_versions.yml        # Versions of all tools used
And here is some of the basic figures. Not exactly publication ready, but the raw data is also available for plotting in alt formats. As expected Mycoplasma genitalium has a noticeable contraction in the most Orthogroups.
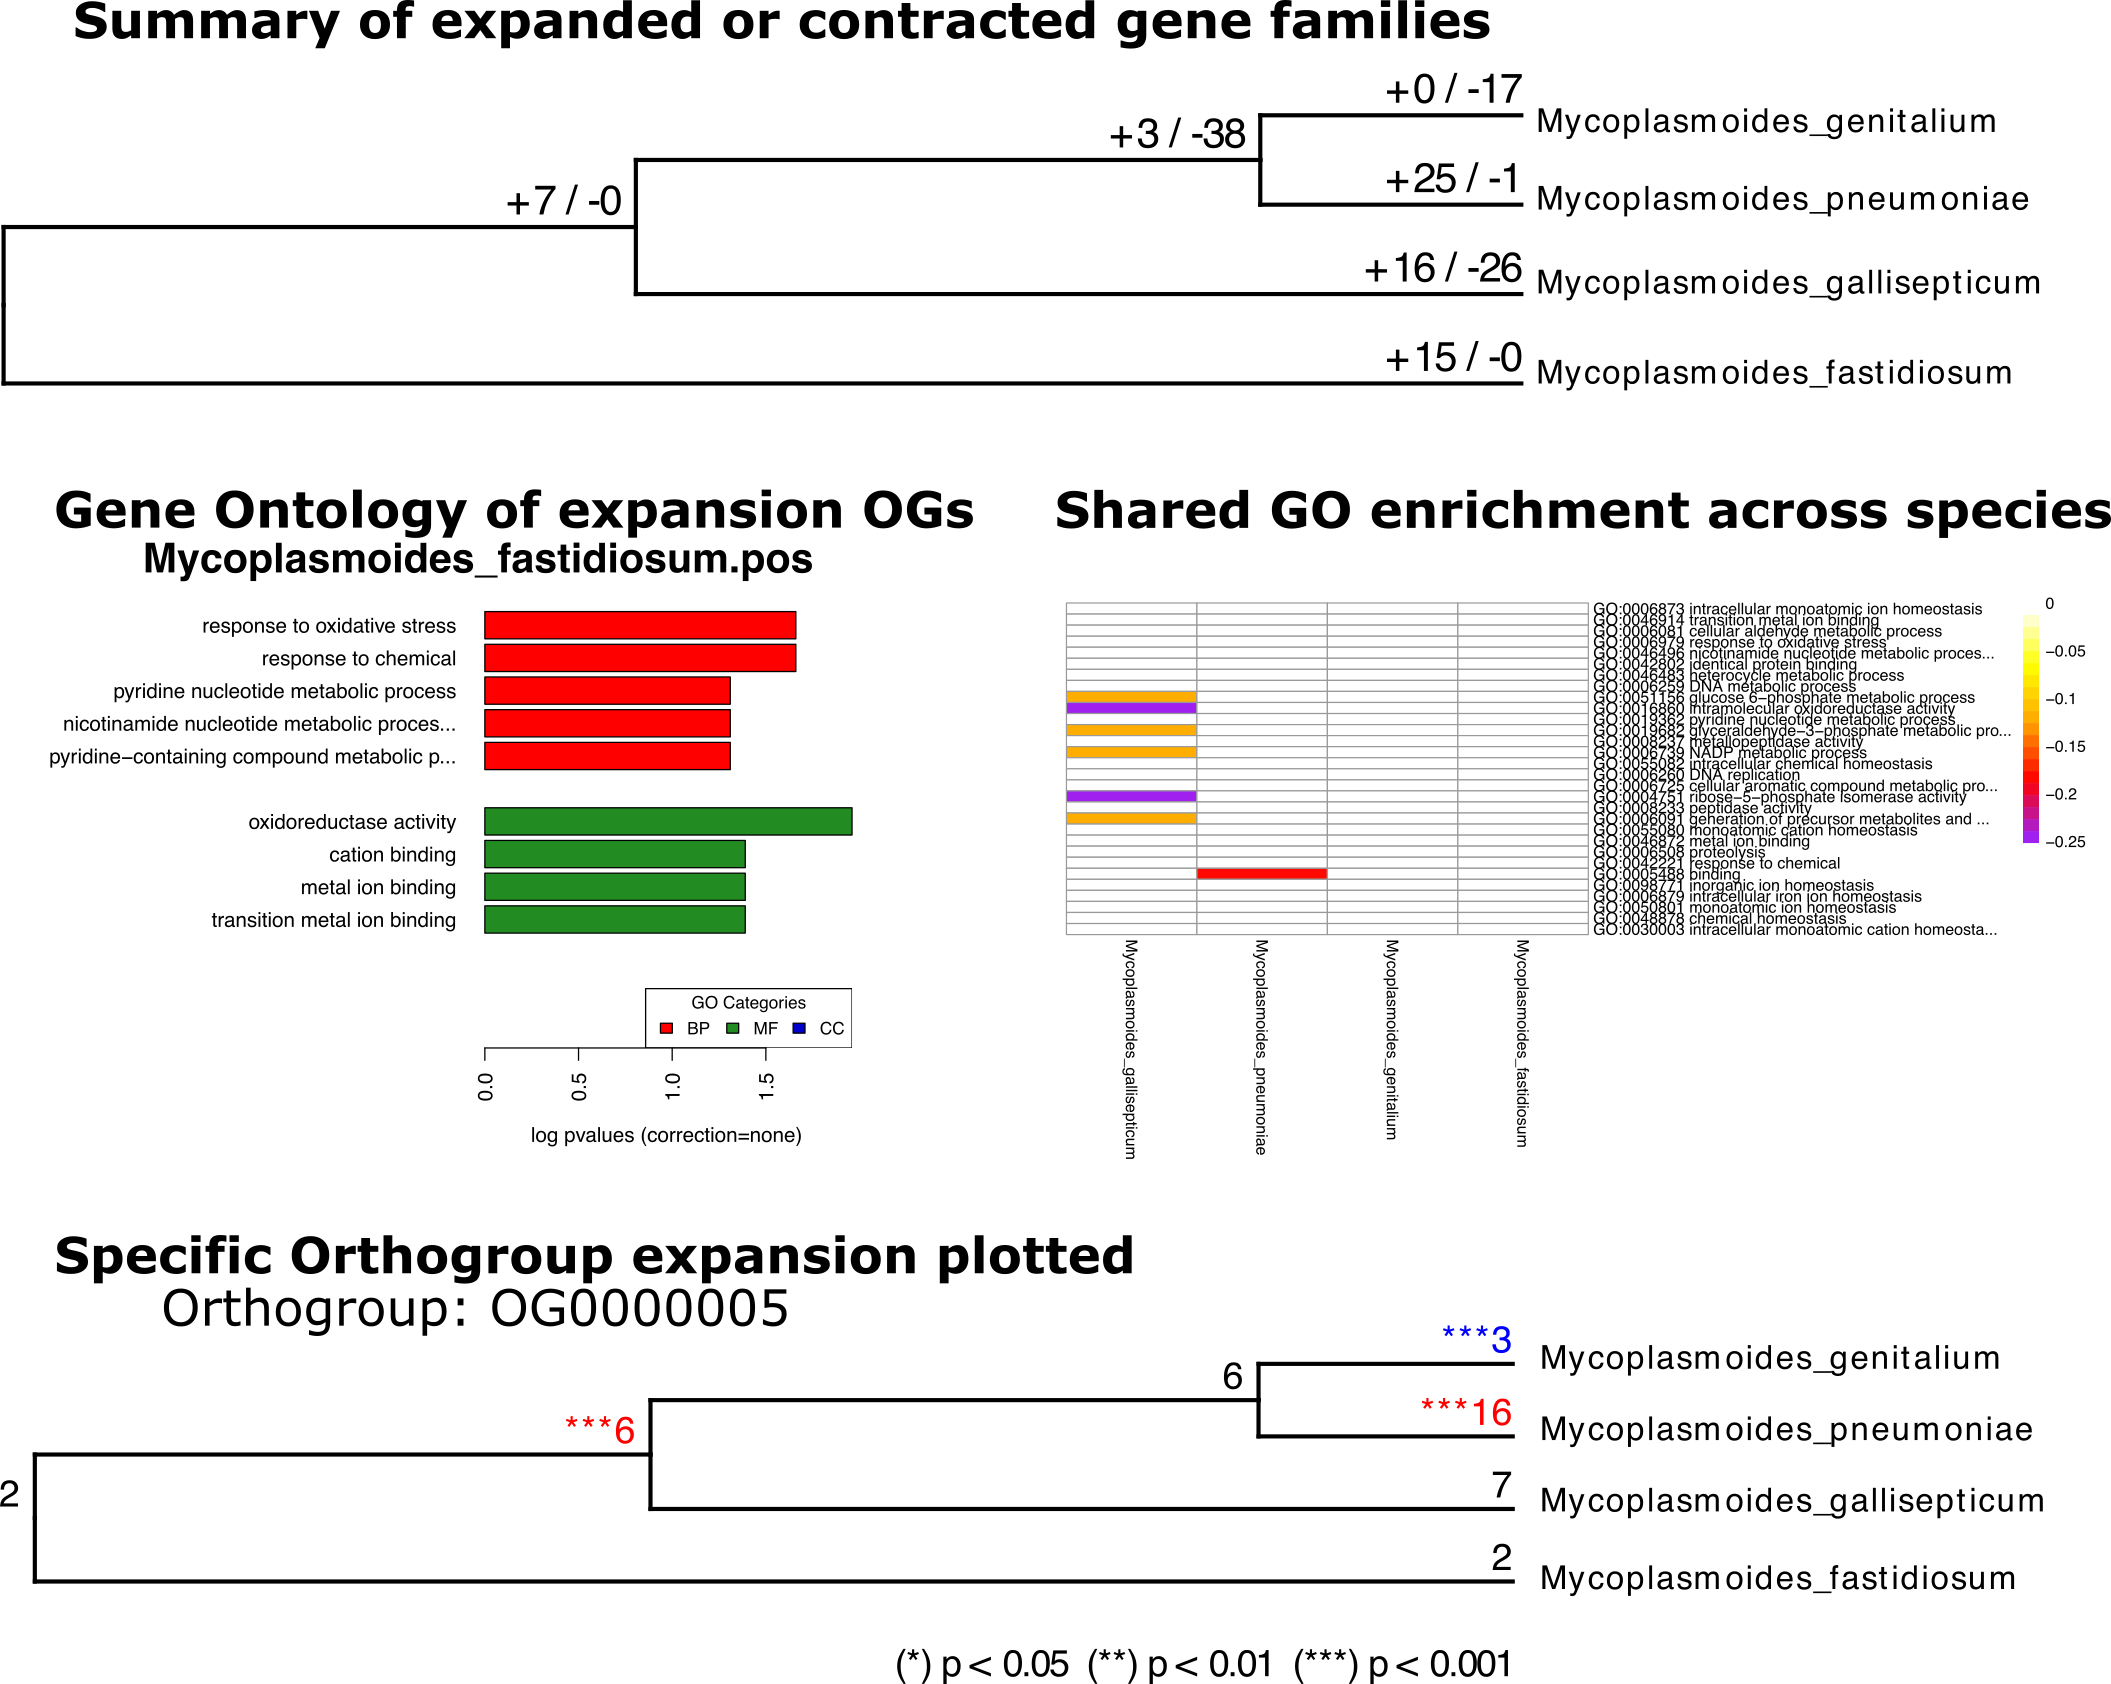
Top: A phylogenetic tree of mycoplasma input, with the number of significant expansion or contraction orthogroups. Left: Example Gene Onyology enrichment analysis showing terms significantly expansed in this species. Right: A heatmap of shared significant GO terms across all species (and nodes- when significant) Bottom: A phylogenetic tree tracing the number of gene copies of a single Orthogroup. Red = sig expansion, Blue sig contraction.
Try it
The fastest way to see excon in action is with the bundled test profile, which uses a small mycoplasma dataset:
NXF_VER=25.10.4 nextflow run main.nf -resume -profile docker,test_bacteria
If you wish to run on bigger datasets, you will need to use a computer with at least 12 cpus and 200GB memory. So a powerful computer or an HPC are recommended. Ask us if you want to deploy this, and we can help.
For additional details, usage instructions, and examples check our our repo linked below. Or shout out to us at ecoflowucl at gmail dot com. Always remember, if you use this pipeline, to cite all the tools that underly it (This is essential to the tool developers!). See the repo for more information.
Links
- 📦 GitHub repository — source code, releases, and issue tracker
- 🔬 WorkflowHub — citable workflow entry
- 📖 nf-core docs — Nextflow installation guide